As one of the clean energy sources, the installed capacity of wind farms has grown rapidly in recent years. Wind farms are divided into onshore wind farms and offshore wind farms. Generally, they are located in remote locations, with scattered installations and harsh environments. Therefore, wind farms need a remote monitoring system to facilitate operation and maintenance personnel to manage wind farm operations more efficiently.
Electrical equipment for wind farms
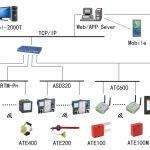
The top cabin of each generating set is equipped with a turbine generator, and the front end is an adjustable fan blade. The system can adjust the inclination angle of the fan blade according to different wind conditions. The general speed of the fan blade is 10-15 rpm points, through the gearbox can be adjusted to a speed of 1500 rpm to drive the generator. An industrial PLC is also configured in the machine room for control and related data collection. The wind speed, wind direction, rotation speed, active power and reactive power of power generation and other related data are collected through the PLC, and the generator is controlled in real time through the collected data. On land, a box transformer is installed at the bottom of the wind tower to be responsible for boosting and converging. According to the power and geographical conditions, multiple wind turbines are boosted once and connected in parallel for converging to the boosting substation. Send electricity to the grid. The electrical wiring diagram of the wind farm is shown in Figure 1. The voltage emitted by the fan is generally 0.69kV, which is boosted to 10kV or 35kV by the box transformer. After multiple parallel confluences, they are connected to the low-voltage side busbar of the step-up substation, and then boosted to 110kV or higher by the main transformer. into power grid.
Different from onshore wind power, due to the harsh environment of offshore wind power (high humidity, high salt density), the dry-type transformer used for primary boosting is integrated in the engine compartment of the draught fan, which not only solves the problem of the entire unit’s footprint, but also it avoids the difficulty of protection caused by installing the transformer at a lower position.

Protection and measurement and control equipment for wind farms
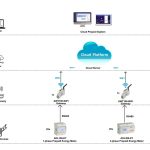
From wind turbine power generation - booster box transformer - confluence - booster station medium voltage busbar - main transformer - booster station high voltage busbar - high voltage outlet - grid connection, the middle needs to be boosted twice before being merged into the grid The power grid has a large number and types of electrical equipment, and any failure in any link will affect the normal operation of the wind farm. Therefore, it is necessary to set up protection and measurement and control devices in all links of the wind farm to comprehensively monitor the operating status of the wind farm. Figure 2 is a schematic diagram of the configuration of the protection and measurement and control devices of the wind farm.

Wind farm monitoring system
The wind farm monitoring platform realizes the monitoring, control and management of the operating status of the wind farm and the real-time data of the wind turbines, improves the reliability and operation efficiency of the wind farm, reduces maintenance costs, and realizes intelligent management.
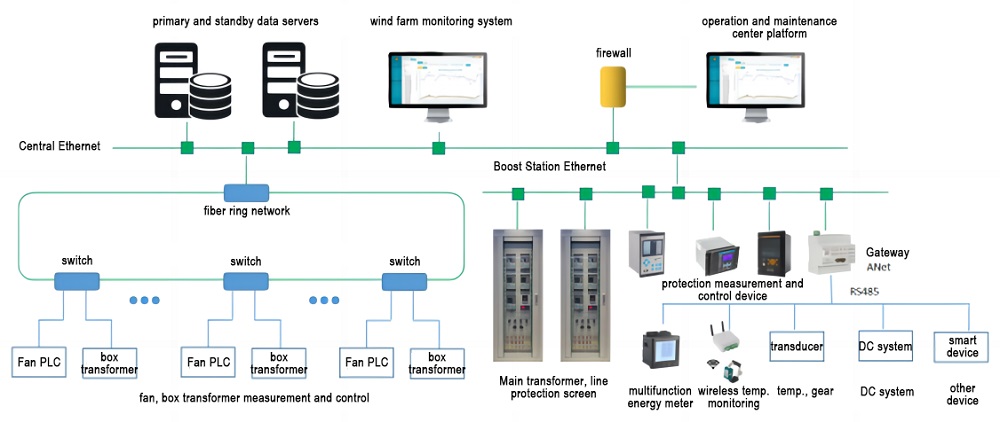
The wind farm covers a relatively large area, and the equipment is scattered. The system has relatively high requirements for data communication reliability and real-time performance. If conditions permit, the optical fiber redundant ring network can be used for data collection and communication, and the LORA wireless method can also be used for data transmission.
The data of the draught fan unit PLC and the box transformer measurement and control device are uploaded to the data server in the control room through the optical fiber ring network, and the data of the comprehensive automation system of the booster station are uploaded to the data server through the Ethernet. Transmitters, DC systems and other smart devices are connected to the communication management machine to upload data to the server.
3.1 Wind farm monitoring
Comprehensive display of the basic parameters of the entire wind farm draught fan (including wind speed, power, speed, etc.), and can realize the daily power generation, monthly power generation, annual The monitoring of power generation is convenient for real-time monitoring of the operating status of the draught fan.
3.2 Crew monitoring
Monitor the parameters and control status of each control module in the unit, including: pitch, yaw, gearbox, generator, hydraulic station, engine room, converter, power grid, safety chain, torque, main shaft, tower base, wind gauge, etc. Realize the comprehensive display of parameters, faults and trend graphs of each module.
3.3 Real-time data display
The draught fan, substations and other equipment in the wind farm are equipped with sensors and monitoring equipment, which can collect the operating electrical data, temperature, vibration and other parameters of the equipment in real time, and give timely warnings in case of abnormalities.
3.4 Power management
The display of active and reactive parameters, the control and adjustment of active and reactive power and other functions can effectively reduce the operating costs of enterprises and provide data support for the goal of energy conservation and emission reduction.
3.5 Production report
Display and report report functions for important parameters such as wind power, wind farm performance indicators, and unit new energy, and support statistics of the operation of each wind farm equipment according to the time dimension (day, month, and year). According to the query method of day, month and year, the important parameters are classified and counted by item, and the report is generated.
3.6 Statistical analysis
Support a variety of statistical analysis functions, fully tap the potential value of data, provide energy-saving optimization solutions, provide decision-making basis for managers, improve the management level of enterprises in a feasible way, and finally achieve the goal of energy-saving, emission reduction and scientific production. The analysis methods include: fault statistics, power curve, availability statistics, wind rose diagram, wind speed power report, monthly and daily utilization and downtime statistics, etc.
Kindly Fill out the Form below and tell us more about your Requirements,
We would like to provide Suitable Solution for You.
or Send us Email directly, [email protected]
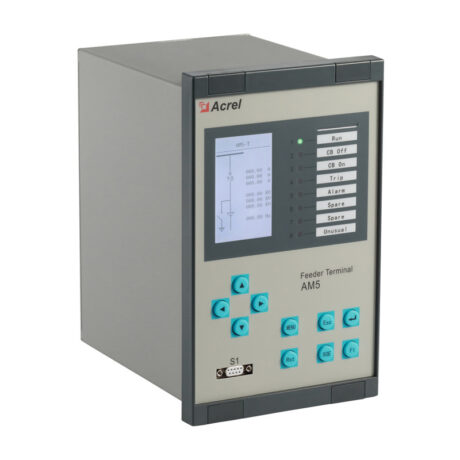
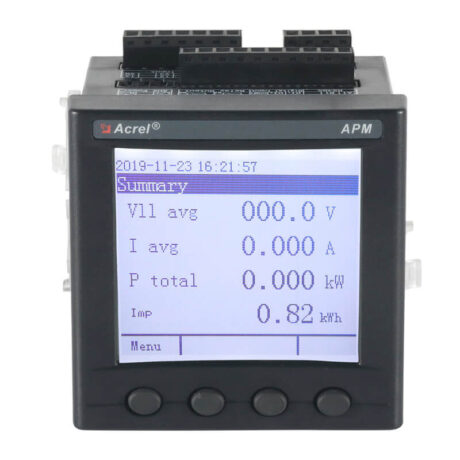
8 current input, 4 voltage input
16 DI, 10 DO
2 RS485, 1 RS232, 1 GPS
Powerful graphic programmable Logic
CE
RED
Radio Equipment Directive (RED) 2014/53/EU


2014/35/EU
2014/30/EU


Kindly Fill out the Form below and tell us more about your Requirements,
We would like to provide Suitable Solution for You.
or Send us Email directly, [email protected]