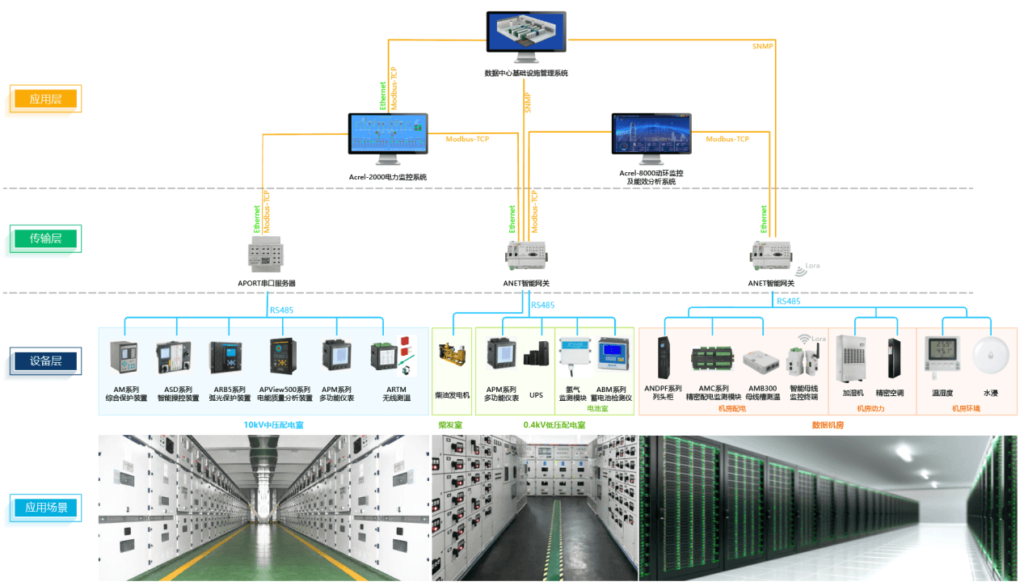
The data center adopts a hierarchical structure,
Collect the power operation parameters of each power distribution equipment and power consumption equipment in the data center,
Realize multi-loop online monitoring, fault alarm and energy efficiency analysis.
Stable and reliable, easy to access. Meet the needs of most data centers.
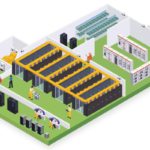
What's the Difficulty of Data Center Power and Environment Monitoring?
What's the Highlight of Data Center Power and Environment Monitoring Solution?
What's the Configuration for Data Center Power and Environment Monitoring Solution?
Through the Acrel-8000 data center dynamic environment monitoring system, real-time monitoring of access control status, flooding status, smoke status, video status, environmental status, high and low voltage power distribution status, and equipment operation status of the data center are realized, and real-time alarms are issued ,
Guarantee the normal operation of the data center, avoid the failure of power distribution equipment caused by the out-of-control operating environment, ensure the safety of maintenance personnel, prolong the service life of equipment, and reduce the excessive cost caused by extensive management of power distribution rooms.
At the same time, it realizes dynamic environment monitoring and conducts energy efficiency analysis on energy consumption, helping users to optimize energy efficiency.
What's the Solution for Data Center Power and Environment Monitoring Solution?
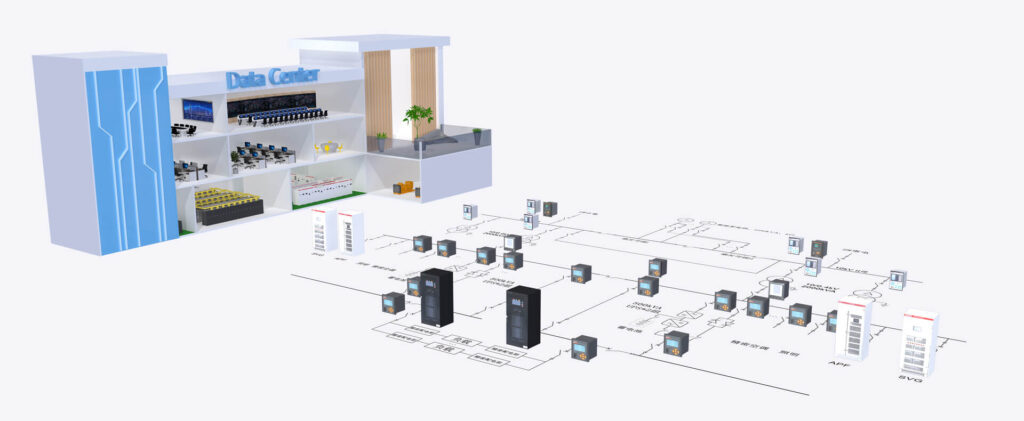
The system adopts a distributed structure, and conducts remote measurement and monitoring of various parameters of the computer room environment such as power cabinets, UPS, air conditioners, batteries, etc. Remote signaling, remote adjustment and remote control, real-time monitoring of its operating parameters,
Diagnose and deal with faults, record and analyze relevant data, and conduct centralized monitoring and maintenance of equipment. Abnormal alarms such as telemetry, remote signaling, and remote control can be realized in the dynamic ring system.
What's the Function of Data Center Power and Environment Monitoring Solution?
On the floor page, the operation status of the equipment on each floor can be monitored in real time through the SVG map.
Transformer monitoring The monitoring page monitors various parameters of each transformer in real time, including the power loss rate. Frequency, power factor, three-phase unbalance, etc., and display the time-lapse graph, and the data changes in real time. It helps users to visually monitor the running status of each transformer.
The power distribution operation report displays all parameters of all circuits in the report, so that users can monitor the operation status of the circuits as a whole.
The energy consumption of each circuit and each time period is counted in the report, and the energy consumption of each day, month, and year is visually displayed.
Display the energy consumption of each power circuit in the same period. Shows the percentage increase or decrease. the
Display each power circuit. Daily, weekly and monthly chain energy consumption. Shows the percentage increase or decrease.
Customize start and end times. And display the meter reading value at the beginning and end of this period in the report.
The energy consumption of each circuit and each time period is counted in the report, and the energy consumption of each day, month, and year is visually displayed. And according to the set electricity price, calculate the electricity fee.
Display the three-phase 1-31 harmonic status and historical data of the current and voltage of each circuit.
The precision power distribution cabinet displays the voltage, current, power, power factor and other parameters of all cabinets in the diagram through the SVG diagram.
The busway displays the voltage, current and three-way temperature of each busway node in the SVG diagram in real time through the SVG picture, and the data changes in real time.
This page displays the power parameters of all branch circuits under the precision power distribution equipment, and supports the query of historical data. Such as
Display the power parameters of all branch circuits under the busway equipment, and support historical data query.
Monitor the running status of UPS equipment in real time through SVG graphs.
Real-time monitoring of the operating status of diesel generator equipment through SVG diagrams.
Real-time monitoring of the operating status of the air conditioner through the SVG graph.
Environmental monitoring mainly includes on-site temperature, humidity, access control status, flooding status, noise and other equipment.
Video monitoring can remotely monitor the situation on site through video.
Display the power consumption of the current data center, IT, air conditioning, and lighting power consumption in each time period.
The energy efficiency dashboard displays the current data center PUE value and historical PUE curve in real time. And display the energy consumption of each sub-item and the ranking of energy consumption. Monitor the operation and load conditions of each transformer, and give the ranking of transformer output power this month.
Display the alarm status of the current data center remote measurement, such as access control, smoke, flooding and other state changes.
Display the current data center remote measurement, such as current, voltage, power and other electrical parameters cross-line alarm situation.
Display the users in the current data center and the operation records of the platform.
Displays the confirmation status of each alarm in the current data center to help users confirm the operating status of the current data center. Remind users of potential security risks.
Kindly Fill out the Form below and tell us more about your Requirements,
We would like to provide Suitable Solution for You.
or Send us Email directly, [email protected]


Kindly Fill out the Form below and tell us more about your Requirements,
We would like to provide Suitable Solution for You.
or Send us Email directly, [email protected]