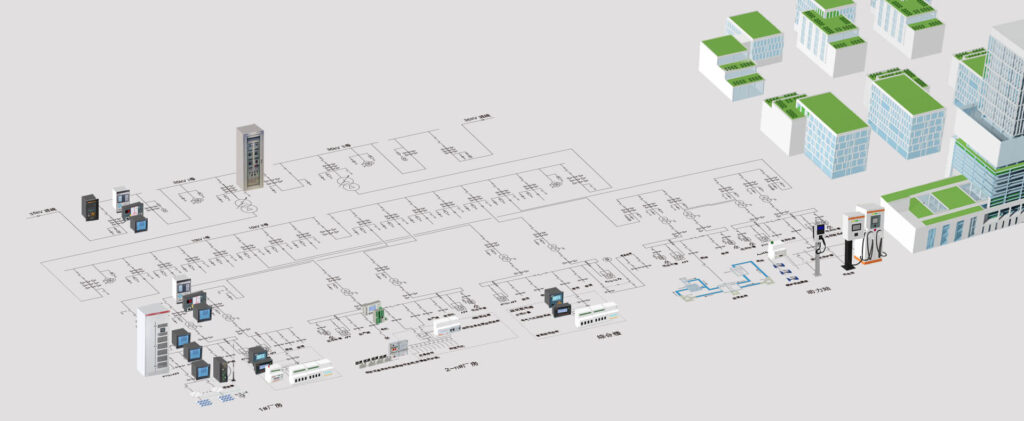
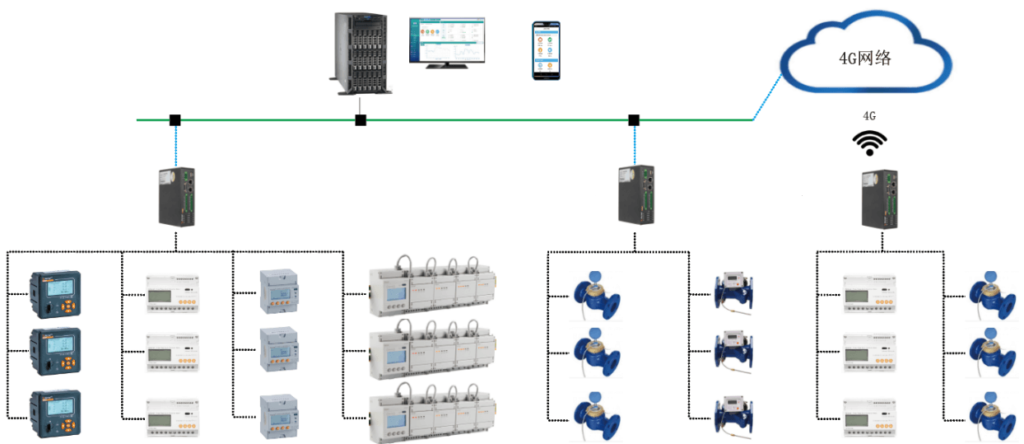
The energy consumption management system collects the three-level electric energy consumption data of the park, analyzes the electric energy by items, and can make statistics according to different electrical equipment, different buildings, and different regions.
For other energy sources, such as water, gas, steam, cold and heat, etc., establish an energy measurement system to trace energy consumption data and monitor abnormal energy consumption.
What's the Difficulty of Smart Park Energy Consumption Management?
What's the Highlight of Smart Park Energy Consumption Management?
What's the Configuration for Smart Park Energy Consumption Management?
Establish an efficient energy consumption monitoring and management system to conduct real-time monitoring of energy usage and alarms at each point in the park. So that park users can monitor the operation of each point in real time, and at the same time grasp the alarms of points more quickly and efficiently, and provide data support for technical improvement measures such as peak shifting and valley filling and load adjustment in the park.
◆ Real-time energy monitoring
Real-time monitoring of energy consumption such as water, electricity, and gas to ensure the safe, continuous and stable operation of energy-consuming links, and display power distribution diagrams, energy flow diagrams, energy balance network diagrams, energy metering network diagrams and other functions.
■ Energy flow diagram: It is necessary to display the consumption of water, electricity and gas in real time on the energy flow diagram; when the energy parameters exceed the limit alarm, it can provide alarm importance classification, and support APP push alarm reminder, SMS alarm reminder, Email, voice alarm prompt, etc.;
■ Power distribution diagram: Draw the real situation of the power distribution room into the power distribution diagram, and display the real-time water and electricity parameters and access control flooding status of the access control, flooding, electricity, water and gas and other instruments connected in real time.
■ Real-time statistics: Real-time statistics of the energy consumption values of factories, workshops, processes, and equipment for the year, quarter, month, week, day, and shift;
■ Data display: display different energy consumption parameters of different regions and different equipment through real-time curves and historical curves;
◆ Safety detection
Centralized display of energy alarm information, relevant processing operations on alarm threshold information, online setting of alarm parameters, when energy parameters exceed the limit alarm, alarm importance level classification can be provided, with SMS and APP push , mail, voice and other information alarm prompts
What's the Solution for Smart Park Energy Consumption Management?
What's the Function of Smart Park Energy Consumption Management?
After successful login, the user enters the large-screen display page to display the energy consumption, output value, abnormality, ranking, proportion, and communication status of the factory and each area. Clicking on an area displays the classified energy consumption, output value, and other related information of the area.
From the dimensions of energy use types, monitoring areas, workshops, production processes, procedures, section time, equipment, teams and groups, sub-items, etc., use curves, pie charts, histograms, cumulative charts, digital tables, etc. to calculate factory energy consumption statistics and year-on-year , Ring-to-ring analysis, actual performance analysis, discounted bid comparison, unit product energy consumption, unit output value energy consumption statistics, find loopholes and unreasonable places in the process of energy use, so as to adjust the energy allocation strategy and reduce waste in the process of energy use.
Display the load conditions of each transformer, so that scientific and reasonable planning can be made for the transformer configuration. Through the comparative analysis of power consumption efficiency under various operating parameter states, find out the best operating mode. The load is adjusted according to the optimal operation mode, thereby reducing the unit consumption of electricity and minimizing the loss of electric energy.
Visually display the current energy consumption flow through graphics, and the start date and end date can be selected.
Statistics of various energy consumption costs of each monitoring node (factory, workshop) for the year, quarter, month, week, and day, including peak electricity, peak electricity charges, valley electricity, valley electricity charges, and average electricity and average electricity charges.
Docking with the factory MES system, through the product output and energy consumption data collected by the system, generate a product unit consumption trend chart in the product unit consumption, and conduct year-on-year and ring-to-ring analysis. At the same time, the product unit consumption is benchmarked against the industry/national/international advanced indicators, so that the factory can adjust the production process according to the product unit consumption, thereby reducing energy consumption.
Perform daily, weekly, monthly, yearly, and specified period performance statistics on the use, consumption, and conversion of various types of energy by teams, regions, workshops, production lines, sections, and equipment. Perform KPI comparisons and assessments based on performance indicators formulated in energy plans or quotas. , to help factories understand internal energy efficiency levels and energy-saving potentials, and assess whether energy consumption is reasonable.
The system collects data on the energy consumption of areas, sections, and equipment, monitors the operating status of key equipment and processes, such as temperature, humidity, flow, pressure, speed, etc., and supports primary operation monitoring of power transformation and distribution systems. You can quickly browse the managed energy consumption data directly from the dynamic monitoring plan, and support querying related energy consumption by energy type, workshop, section, time and other dimensions.
Users can flexibly produce various reports by customizing report headers and columns, and view information such as energy consumption, unit consumption, cost, and comprehensive energy consumption of each node in the factory, and report year-on-year and ring-by-quarter, and export reports are supported.
Provide graphical comparative analysis of energy consumption costs, including year-on-year and chain-to-period analysis by time period (day, month, year), statistical and graphical comparative analysis by classification, time period, and item (location, organization, key equipment) (histogram, pie chart) , stacked graphs, etc.).
Carry out comprehensive statistical analysis on the energy utilization, line loss, equipment operation, operation and maintenance of the factory by year, month, and day, so that users can fully understand the operation of the system, and provide users with a data basis to facilitate users to discover Equipment abnormalities, so as to find out the improvement points, and tap the energy-saving potential according to the energy consumption situation.
Monitor the operation, shutdown and abnormal status of key energy-consuming equipment, and promptly solve equipment failures and outages that lead to normal production.
According to the classification of nodes and energy, query the energy loss data on each node line, timely discover the problems of energy leakage and abnormal energy consumption during the use process, and remind users to intervene in time.
Statistics on the change trend of total carbon emissions by region, and a year-on-year analysis. Calculate the carbon emissions per unit of output value, and combine the emission reduction indicators to realize the early warning of exceeding the standard, improve the regional emission reduction level, and promote the realization of the carbon peak goal.
The system supports equipment operation and maintenance management such as equipment daily inspection plan, dispatching workers, eliminating defects, repairing, dispatching workers, etc., which is convenient for operation managers to formulate inspection plans and dispatch workers, and inspectors to perform inspections, complete work orders, and patrol inspections Find problems and eliminate defects, report faults for repairs, follow up the progress of repairs, and meet the needs of daily inspections and equipment maintenance.
Aiming at the dual control of electrical safety, power limitation and energy consumption, it realizes alarms for abnormal electrical parameters, electrical fire hazards, excessive energy consumption, and power shortages, etc., helping factories to give early warnings and avoid fire accidents and energy costs caused by fines too high. Support hierarchical and classified alarms, and can dispatch and close-loop processing the alarms.
Statistical analysis of peak, peak, flat, valley power consumption and costs, providing data support for time-sharing power consumption of factories and optimization of cost-effectiveness.
The APP supports Android and iOS operating systems, which is convenient for users to grasp factory energy consumption, production line comparison, efficiency analysis, year-on-year comparison analysis, energy consumption conversion, and event records according to different dimensions such as energy classification, area, workshop, process, team, and equipment. , Operation monitoring, abnormal alarm, power distribution diagram, process flow diagram, energy flow diagram, etc.
2014/30/EU
2014/32/EU
2014/35/EU
IEC62052-11, IEC62053-22
EN61010-1, EN61000-3
![]()


CE-RED, IEC, LVD, EMC

2014/30/EU
EN IEC 61000
2014/35/EU
EN IEC 61000
EN61010
Standard Lead Time:
Sample: 2 days
Bulk: 1 month
Kindly Fill out the Form below and tell us more about your Requirements,
We would like to provide Suitable Solution for You.
or Send us Email directly, [email protected]


Kindly Fill out the Form below and tell us more about your Requirements,
We would like to provide Suitable Solution for You.
or Send us Email directly, [email protected]