With carbon peaking and carbon neutrality becoming the main task of government work,
As a large-scale building with intensive energy consumption and a complex energy consumption situation, the factory
Effectively reduce energy consumption, reduce energy costs,
Avoid the phenomenon of "running and dripping" in the process of energy use,
The implementation of comprehensive energy efficiency evaluation is a very necessary management method.
What's the Difficulty of Factory Energy Consumption Management?
What's the Highlight of the Factory Energy Consumption Management System Solution?
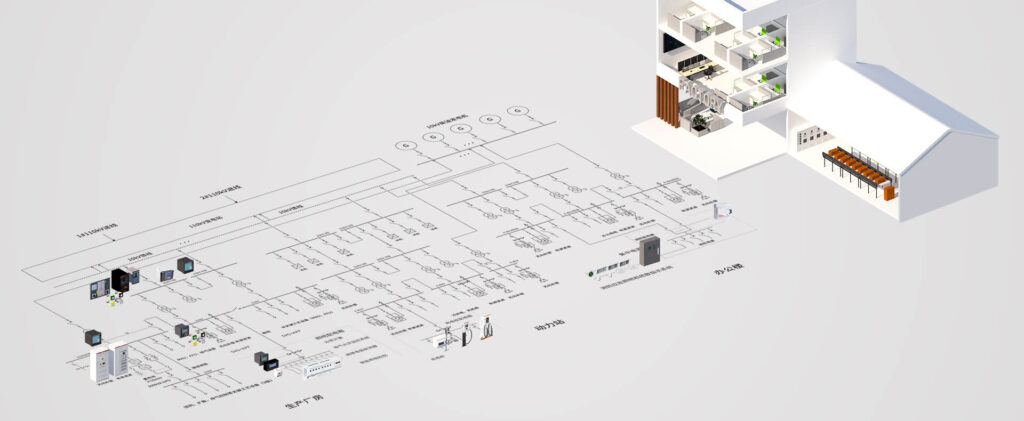
How to Configure the Factory Energy Consumption Management System?
Establish an efficient energy consumption monitoring and management system to conduct real-time monitoring of energy usage and alarms at various points in the factory.
So that factory users can monitor the operation of each point in real-time, and at the same time, they can grasp the alarm of the point more quickly and efficiently, and provide data support for the factory's technical transformation measures such as peak shaving and valley filling, and load adjustment.
◆ Real-time monitoring of energy
Real-time monitoring of water, electricity, gas, and other energy consumption,
To ensure the safe, continuous, and stable operation of the energy-consuming link,
Display power distribution diagram, energy flow diagram, energy balance network diagram, energy metering network diagram, and other functions.
■ Energy flow diagram:
The consumption of water, electricity, and gas needs to be displayed in real-time on the energy flow diagram;
When the energy parameter exceeds the limit alarm, it can provide alarm importance classification, and support APP push alarm prompt, SMS alarm prompt, email, voice alarm prompt, etc.;
■ Distribution diagram:
Draw the real situation of the power distribution room in the power distribution diagram,
Real-time display of the real-time water and electrical parameters of the access control, water immersion, electricity, water, gas, and other instruments, and the access control water immersion status.
■ Real-time statistics:
Real-time statistics of energy consumption values of factories, workshops, processes, and equipment in the current year, quarter, month, week, day, shift, etc.;
■ Data display:
Display different energy consumption parameters of different areas and different equipment through real-time curves and historical curves;
◆ Security Detection
Centralized display of energy alarm information,
processing alarm threshold information,
Set alarm parameters online,
Alarm importance level classification, with SMS, APP push, email, voice and other information alarm prompts
What's the Function of Factory Energy Consumption Management System Solution?
From the dimensions of energy use, workshop, production process, process, equipment, etc., use curves, pie charts, histograms, cumulative graphs, digital tables, etc. to make statistics on factory energy consumption, year-on-year, and ring-to-ring analysis, unit product energy consumption, unit Output value energy consumption statistics, to find loopholes and unreasonable places in the process of energy use, so as to adjust the energy distribution strategy and reduce waste in the process of energy use.
Display the load conditions of each transformer, so as to make scientific and reasonable planning for the allocation of transformers. Through the comparative analysis of power efficiency under various operating parameters, find out the best operating mode and adjust the load, so as to reduce the unit power consumption and minimize the power loss.
Statistics of various energy consumption costs of each monitoring node (factory, workshop) for the year, quarter, month, week, and day.
Docking with the factory MES system, through the product output and energy consumption data collected by the system, generate a product unit consumption trend chart in the product unit consumption, and conduct year-on-year and ring-to-ring analysis. At the same time, the unit consumption of the product is compared with the indicators of the industry/country/international advanced enterprises, so that the factory can adjust the production process according to the unit consumption of the product, thereby reducing energy consumption.
Perform daily, weekly, monthly, yearly, and designated period performance statistics on the use, consumption, and conversion of various types of energy by the team, area, workshop, production line, section, and equipment. Carry out KPI assessments in accordance with energy plans to help factories understand internal energy efficiency levels. and energy-saving potential to assess whether energy consumption is reasonable.
Statistics on the change trend of total carbon emissions by region, and a year-on-year analysis. Calculate the carbon emissions per unit of output value, and combine the emission reduction indicators to realize the early warning of exceeding the standard, improve the regional emission reduction level, and promote the realization of the carbon peak goal.
Users can view the energy consumption, unit consumption, cost, and other information of each node of the factory through custom reports, and support export.
Visually display the current energy consumption flow through graphics, and the start date and end date can be selected.
Statistical analysis of peak, peak, flat, valley power consumption and costs, providing data support for time-sharing power consumption of factories and optimization of cost-effectiveness.
Statistical analysis of energy utilization, line loss, equipment operation, etc. in the factory by year, month, and day, so that users can fully understand the operation of the system, and provide users with a data basis to facilitate users to find equipment abnormalities and find out improvement points , and tap the energy-saving potential according to the energy consumption situation.
2014/35/EU
2014/30/EU
 Standard Lead Time:
Sample: 2 days
Bulk: 1 month
2014/30/EU
2014/32/EU
2014/35/EU
IEC62052-11, IEC62053-22
EN61010-1, EN61000-3
![]()


2014/30/EU
EN IEC 61000
IEC 62052
IEC 62053
 Standard Lead Time:
Sample: 2 days
Bulk: 1 month
Kindly Fill out the Form below and tell us more about your Requirements,
We would like to provide Suitable Solution for You.
or Send us Email directly, [email protected]


Kindly Fill out the Form below and tell us more about your Requirements,
We would like to provide Suitable Solution for You.
or Send us Email directly, [email protected]